top of page
Design Highlights
Visualize Revisions
Visualize the revised and retained items.
Identify the main scope and users needs
Give user the ability to analyze the revisions submitted for the project.
Shared vision
Created the ideal flowchart for submission of revised items and provided use case scenarios.

FLOWCHART
Introduction of new components
To help visualize the revisions submitted within the projects, different types of graphs were introduced. Graphs help to display the pattern and compare changes on a certain period.

BAR AND LINE GRAPHS
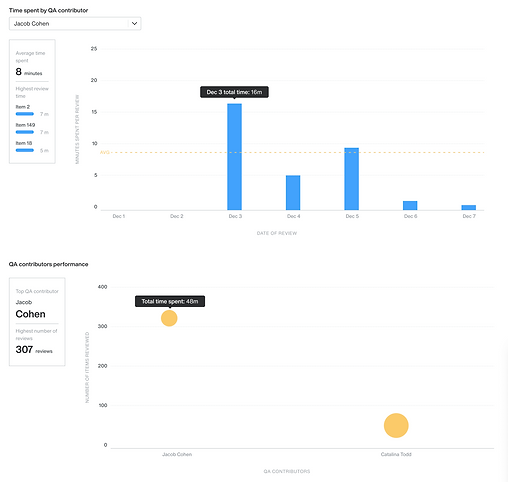
BAR AND SCATTER PLOT GRAPHS
Another addition is the Revision history table where user could see the detailed information about the revised item.

HISTORY TABLE
bottom of page